
LinkedIn announces inaugural State of Salary Report (U.S.)

Introduction From Guy Berger, LinkedIn’s Economist
The job market in the United States is tightening, and that’s a good thing for professionals. The unemployment rate is the lowest it's been since 2001, and the percentage of prime working age adults who are employed is the highest it’s been since 2008.
While the steady improvement of the job market over the past year hasn’t been the same across all industries and job functions, things have gotten better for workers across skill levels, industries and regions. What does this mean for you? Bargaining power for many workers, like you, is increasing and opens the door to raises, and greater economic opportunity
Salary is a key factor in most career decisions. When deciding where to work, where to live, or what to study, pay is often top of mind. The problem is, you don’t always have the compensation data you need to make the best decisions. You decide between paths without knowing the payoffs.
To give you more visibility into your next career move, we examined data from more than two million LinkedIn members. We looked at how salaries vary by job title, education level and field of study, location, company size, and industry.
Key Findings
| Job title | Highest-paying job overall: orthopedic Surgeon, $450,000 |
| Experience level | Highest-paying junior-level job: investment banking analyst, $105,000 |
| Education level | Highest-paying degree: doctor of medicine (MD), $161,200 |
| Field of study | Highest-paying field of study: computer science, $92,300 |
| Company size | Highest-paying company size: 10,001+ employees, $90,600 |
| Industry | Highest-paying industry: software and IT services, $104,700 |
| Location | Highest-paying region: San Francisco Bay Area, $112,400 |
Read on to see how your pay stacks up and what path you might want to take as you evaluate your next career opportunity. Explore how much you could make if you went back to school, moved to another city, or switched industries. Get inspired by what you could do to increase your compensation.
There’s no one path to high earning potential, but now you can better assess your choices along the way. Use this guide to gut-check your professional instincts and learn more about your own salary in the LinkedIn Salary tool, and your career will thank you.
Highest-Paying Jobs In the U.S.
Let’s start at the top with the highest-paying jobs overall.
Medicine pays the most, but once you reach the top ranks in business, you’re paid generously too. Leadership roles in finance, sales, tax, human resources, strategy, supply chain, research and development, marketing, and legal are all alternate routes to a high salary.
Doctors account for eight of the top 20 highest-paying jobs, with most earning more than $300,000 annually. Orthopaedic surgeons take the top spot at $450,000.
Finance pays the largest bonuses. This means greater salary variability but also greater potential upside. If you have a higher tolerance for risk, finance may suit you.
Investment banking associate is the only mid-level role in the top 20.
For certain job roles four cities stand out as more lucrative places to live: New York, Los Angeles, San Francisco and Boston.
Highest Paying Jobs: Overall
| Role* | Median Total Compensation (includes bonus and commission if applicable) | Median Cash Bonus |
| 1. Orthopaedic Surgeon | $450,000 | $60,000 |
| 2. Cardiologist | $382,000 | $50,000 |
| 3. Radiologist | $374,000 | $50,000 |
| 4. Plastic Surgeon | $350,000 | $90,000 |
| 5. Anesthesiologist | $350,000 | $25,000 |
| 6. Emergency Physician | $314,000 | $20,000 |
| 7. Senior Vice President, Finance | $300,000 | $80,000 |
| 8. Senior Vice President, Sales | $300,000 | $60,000 |
| 9. Senior Managing Director | $298,000 | $100,000 |
| 10. Vice President, Tax | $272,000 | $67,500 |
| 11. Senior Vice President, Human Resources | $272,000 | $57,500 |
| 12. Senior Vice President, Strategy | $256,000 | $50,000 |
| 13. Vice President, Supply Chain | $255,000 | $62,500 |
| 14. Ophthalmologist | $250,000 | $50,000 |
| 15. Medical Director | $250,000 | $36,000 |
| 16. Vice President, Research & Development | $248,000 | $60,000 |
| 17. Senior Vice President, Marketing | $245,000 | $50,000 |
| 18. Associate General Counsel | $242,000 | $46,000 |
| 19. Investment Banking Associate | $240,000 | $100,000 |
| 20. Senior Director, Engineering | $239,000 | $40,000 |
*If total median salary was the same for more than one role, the role with a higher annual bonus placed higher on this list
Highest-Paying Entry and Mid-Level Jobs
It can take years to gain the skills you need to land one of the highest-paying jobs. So let’s consider the highest-paying jobs at the more junior level, ones that only require 1-3 years of experience.
If you’re early in your career, you can still make six figures. Both investment banking analysts and associate brand managers have a median income of more than $100,000.
The most lucrative entry and mid-level jobs are in finance, but roles in sales, marketing, and engineering also take spots on the list.
Highest Paying: Entry and Mid-Level Jobs
| Role* | Median Total Compensation (includes bonus and commission if applicable) | Median Cash Bonus (if applicable) |
| 1. Investment Banking Analyst | $105,000 | $40,000 |
| 2. Associate Brand Manager | $105,000 | $10,000 |
| 3. Equity Research Analyst | $79,500 | $8,700 |
| 4. Pharmaceutical Sales Representative | $75,000 | N/A |
| 5. User Experience Designer | $72,000 | $5,000 |
| 6. Pilot | $70,000 | N/A |
| 7. Product Development Engineer | $68,000 | $3,300 |
| 8. Associate Marketing Manager | $66,000 | $6,700 |
| 9. Associate Software Engineer | $65,000 | $5,000 |
| 10. Outside Sales Representative | $57,000 | $4,000 |
*If total median salary was the same for more than one role, the role with a higher annual bonus placed higher on this list
Where Education Makes An Impact
Education is an investment in your earning potential, but let’s explore just how much it matters.
Generally the more you learn, the more you earn. There is a positive correlation between years of education and salary. It ranges from high school diploma ($52K) to medical degree ($161K.)
The nearly $30,000 salary increase between secondary education and bachelor’s degree (BA) shows the high value of attending a four-year college after high school. The degree positions you to earn a salary that’s just below the national average.
Graduate degrees have a wide payoff range, earning 3%-13% more than the average U.S. salary. Doctor of medicine (MD) leads the pack and is more lucrative than business (MBA) and law (JD). Master’s (MA) and research doctorates (PhD) earn more than BA’s, but still less than $100K on average.
Advanced degrees have greater salary impact on any given role. For example, a design engineer with a PhD can earn 56% more than the national average. Similarly, having an MBA can bump a program director’s salary to double the national average.
Education Level and Annual Salaries in the U.S.
 Field of Study and Annual Salaries in the U.S.
Salary potential is often a key factor when students decide what to study. Which fields can earn you the most?

If you want to land a high-paying job, computer science is your best bet. Computer science leads all other fields of study with an average salary of $92K while visual art and sociology round out the top three with $90K and $88K, respectively.
- STEM (science, technology, engineering, and math) accounts for nearly half of the highest paid fields, with engineering taking the majority of the spots. Considering today’s high demand for tech talent, this comes as no surprise.
However, just as many non-technical fields in the arts and social sciences rank high as well. The bottom line is you don’t have to be a tech whiz in school to earn big bucks when you graduate - a wide range of fields lead to high pay.
Top 20 Highest Paying Fields of Study in the United States
| Field of Study | Median Total Compensation (includes bonus and commission if applicable) |
| 1. Computer Science | $92,300 |
| 2. Visual Art | $90,390 |
| 3. Sociology | $87,900 |
| 4. Industrial Engineering & Management Science | $85,800 |
| 5. Business Management & Administration | $83,700 |
| 6. Architecture, Design & Applied Art | $81,200 |
| 7. Law | $79,000 |
| 8. Electrical & Electronic Engineering | $78,600 |
| 9. Physics | $78,400 |
| 10. Journalism, Media & Communication | $77,979 |
| 11. Religion | $75,000 |
| 12. Engineering | $73,350 |
| 13. Liberal Arts | $72,500 |
| 14. History | $71,700 |
| 15. Civil Engineering | $69,100 |
| 16. Mechanical Engineering | $66,700 |
| 17. Language & Literature | $65,700 |
| 18. Economics | $64,300 |
| 19. Science | $63,800 |
| 20. Environmental Science & Forestry | $55,700 |
Company Size Can Make A Difference
Company size as measured by employee headcount is an important deciding factor for many professionals. Let’s see how salaries compare.

Larger companies on average pay more. This makes sense as they generally have more resources than smaller companies and thus can pay more for talent. Keep in mind smaller companies that can’t compete on salary alone often compensate with less quantifiable perks such as strong company culture.
Roles are compensated differently depending on company size. For example, if you’re an implementation specialist at a mid-size company, you may be better off moving to a smaller shop where you’ll be paid more for the same job. If you’re an art director at a startup, you may decide to pursue the same role at a large company where you’ll likely make more.
How Different Industries Are Paid, And How Men & Women Are Represented
Certain industries pay more than others and have a disproportionate number of males or females. Let’s look at the gender breakdown within the highest-paying industries. Note: this is not a pay comparison of men and women in equal jobs - it is simply a comparison of gender ratios within industries.
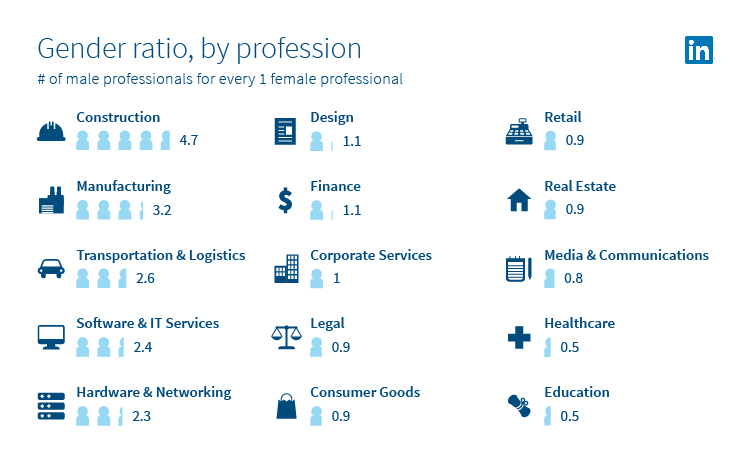
Men are greatly overrepresented in the highest-paying industries. Software and hardware tech industries pay the most and have over twice as many males than females. Manufacturing pays third-highest and has an even greater discrepancy - over three times as many males.
Healthcare is the only top-five paying industry with a greater proportion of females. Consumer goods, legal, media, retail, real estate, and education have a higher female ratio too, but the imbalances are less compared to those in the male-dominated industries.
Construction has the most glaring gender imbalance, with nearly five males for every female. Corporate services has the most equal balance with a 1-to-1 ratio of men to women.
If you’re a woman in a male-dominated industry such as construction, for example, now you can compare your salary to the median and get a sense of whether you’re being underpaid.
Salary by Industry
| Industry | Median Total Compensation (includes bonus and commission if applicable) | Median Bonus |
| 1. Software & IT Services | $104,700 | $11,700 |
| 2. Hardware & Networking | $101,100 | $11,500 |
| 3. Manufacturing | $85,600 | $9,600 |
| 4. Healthcare | $84,600 | $10,900 |
| 5. Finance | $82,800 | $13,000 |
| 6. Consumer Goods | $80,000 | $11,000 |
| 7. Construction | $78,500 | $7,300 |
| 8. Corporate Services | $75,000 | $7,800 |
| 9. Legal | $72,600 | $3,900 |
| 10. Media & Communications | $71,900 | $5,900 |
| 11. Transportation & Logistics | $70,200 | $8,400 |
| 12. Retail | $69,300 | $7,950 |
| 13. Real Estate | $68,600 | $8,500 |
| 14. Design | $67,800 | $3,300 |
| 15. Education | $59,500 | $5,100 |
Location, Location, Location
Where you live is tied to how much you earn. Let’s see how salaries stack up across the nation.
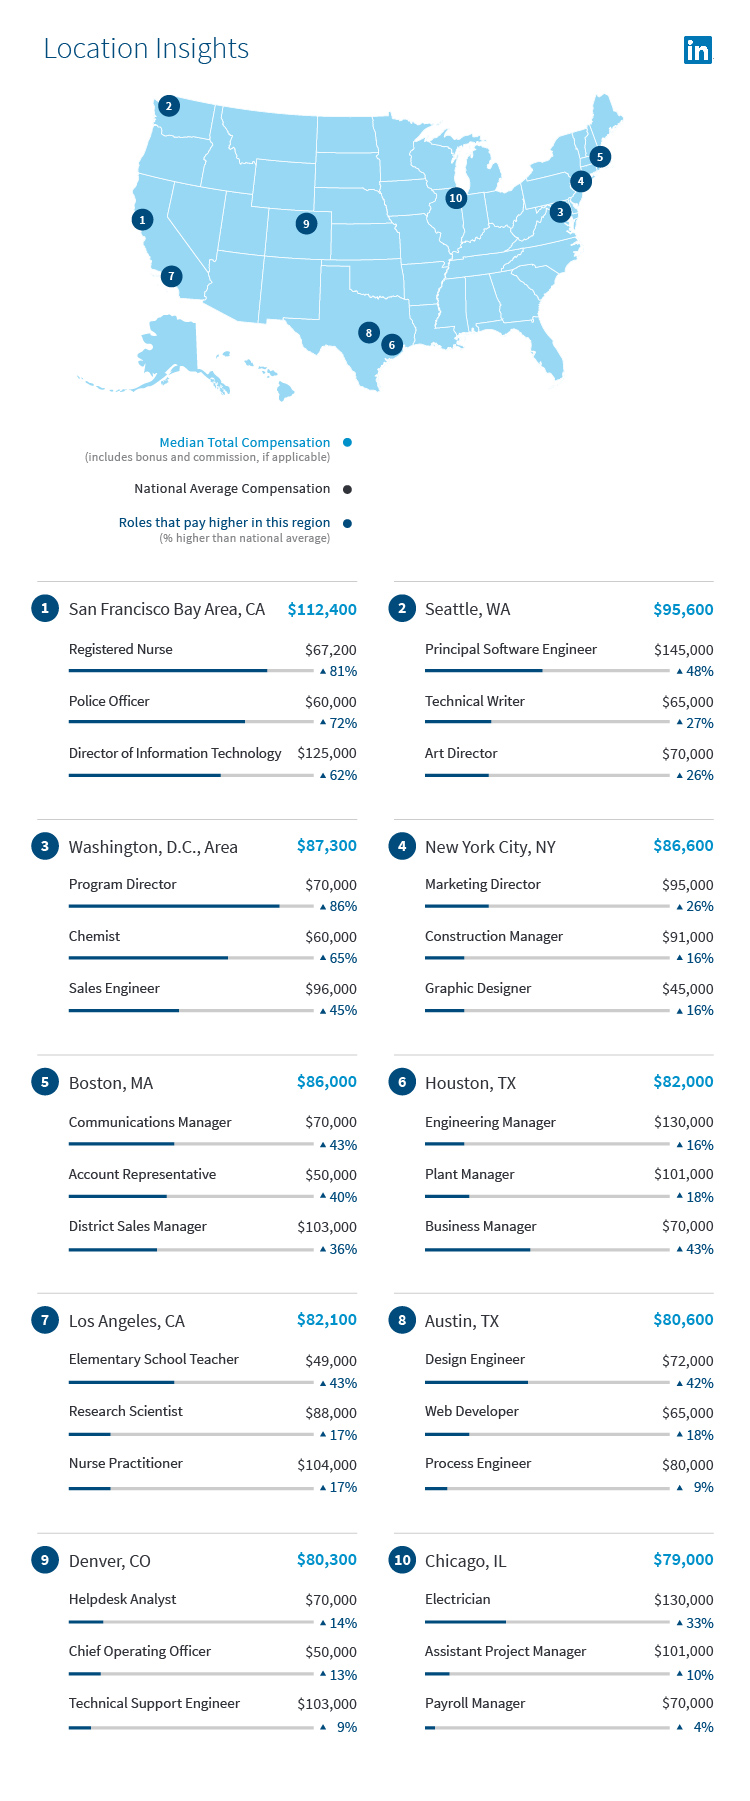
The San Francisco Bay Area leads the country with highest average salary, and the only city exceeding $100K. Helping cement the west coast as the higher-paying coast, Seattle takes the second spot with an average salary of $96K.
The East Coast cities of Washington D.C., New York and Boston round out the top five. Not surprisingly it’s these coastal cities, with typically higher costs of living, that tend to pay most.
Engineering roles are in high demand nationwide as most regions in the top 20 pay above average for those roles. So if you’re an engineer who’s willing to move to Texas, for example, you’ll likely find higher-paying opportunities in Houston, Austin, and Dallas.
If you are planning a career change and are willing to move locations, consider these top-paying regions. If want a change from Los Angeles, for example, Denver may be a great alternative because you could earn a similar salary.
METHODOLOGY:
LinkedIn’s State of Salary Report showcases the state of pay across the United States based on salary data from over two million LinkedIn members as of April 2017.
To protect member privacy, we de-identify salary data at the time of submission. Once we collect a sufficient number of submissions to analyze the data while protecting member privacy, we aggregate the data at a job title and location level and securely stored the median reported values.
To uncover higher-level trends that were not job title-specific (such as Average Pay by Field of Study), we computed the average median value across all job titles for which we had aggregate salary insights available. Insights generated from fewer than 30 salary submissions were removed from the analysis. C-level titles (such as CEO, CIO, etc.), were also excluded from the analysis.
The results of this analysis represent the world as seen through the lens of LinkedIn data. As such, our sample is restricted to LinkedIn members and is affected by how members choose to use the site, which can vary based on professional, social, and regional culture, as well as overall site availability and accessibility.
For more information on how LinkedIn collects and reports on salary information, check out our engineering blog.